KC metro has new bragging rights; named one of Midwest’s most affordable cities
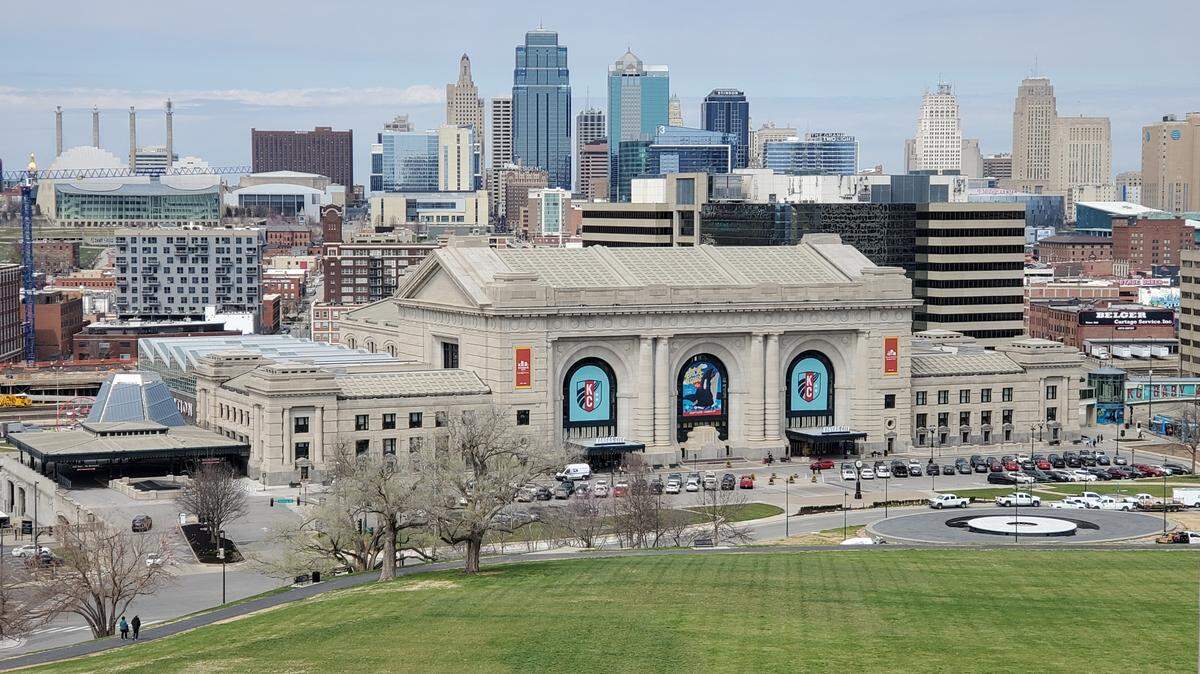
The Kansas City metro has new bragging rights, after being ranked second on a list of the 10 most affordable cities with high salaries and low cost of living in the Midwest by The Motley Fool.
The highest-ranked city, Joliet, Illinois, has an estimated income-to-expense ratio of 1.25 and a cost-of-living index of 94.4. Not far behind, Kansas City has an estimated income-to-expense ratio of 1.23 and a cost-of-living index of 91.1, meaning the city is affordable, with a low cost of living and high median income, according to the private company focused on financial and investing advice.
The affordability ranking was calculated by analyzing the cost of living and the median household income of each city to get scores like the cost-of-living index and the estimated income-to-expense ratio, which explains how much of people’s earnings go toward expenses.
Kansas City has a median household income of $81,927 and a cost-of-living estimate of $66,473, the company’s data showed.
Out of all the Midwest cities, Chicago was determined to be the most expensive Midwest city. The city had a cost-of-living index of 115.1, around 1.26% higher than Kansas City’s index score.
In comparison, the title of the cheapest Midwest city to live in — based solely on cost of living — was given to Richmond, Indiana, with a cost-of-living index of 81.2.
For their national rankings, McKinney, Texas, was named as the most affordable city in the U.S. The city has an estimated income-to-expense ratio of 1.55 and a cost of living index of 97.5. Its median household income stands at $116,654, and the cost of living is estimated to be $75,348. Although McKinney scores higher overall, Kansas City residents still have a lower cost-of-living estimate.
Here’s the list of the 10 most affordable places to live in the Midwest, according to The Motley Fool:
| Ranking | City | Estimated Income-to-Expense Ratio | Cost-of-Living Estimate | Median Household Income | Cost-of-Living Index |
| 1 | Joliet, Illinois | 1.25 | $68,881 | $86,054 | 94.4 |
| 2 | Kansas City Metro | 1.23 | $66,473 | $81,927 | 91.1 |
| 3 | Indianapolis, Indiana | 1.19 | $64,795 | $77,065 | 88.8 |
| 4 | Minot, North Dakota | 1.19 | $65,160 | $77,431 | 89.3 |
| 5 | Bismark, North Dakota | 1.14 | $66,327 | $75,846 | 90.9 |
| 6 | Minneapolis, Minnesota | 1.12 | $72,334 | $81,001 | 93.6 |
| 7 | Sioux Falls, South Dakota | 1.07 | $66,400 | $70,925 | 91.0 |
| 8 | Pierre, South Dakota | 1.06 | $69,861 | $74,053 | 90.4 |
| 9 | Davenport-Moline-Rock Island, Iowa-Illinios | 1.03 | $69,629 | $71,925 | 90.1 |
| 10 | Rapid City, South Dakota | 1.02 | $68,516 | $70,094 | 93.9 |
Data source: Census Bureau (2024), Council for Economic and Community Research (2025), Motley Fool Money calculations.